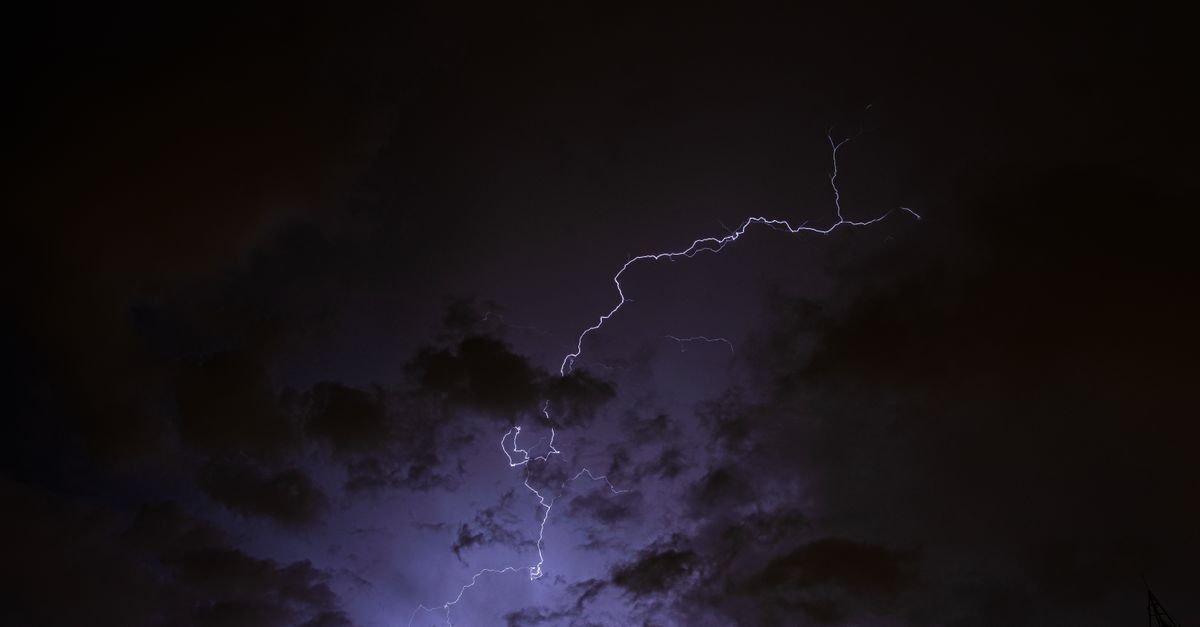
At 3:47 PM, a severe thunderstorm warning covers a 12-mile radius. Your phone buzzes with a generic push notification. Yet, three miles east, a large hailstone shatters a windshield, while two miles west, the sky remains clear. This spatial resolution gap exposes a fundamental limitation in how most mobile interfaces handle meteorological data. The raw information exists, but the processing layers—interpolation, filtering, and latency—often dilute the precision necessary for immediate local action.
Modern systems rely on coarse grid points to generate a weather forecast that feels uniform across vast geographic areas. This approach prioritizes broad visual clarity over hyper-local detail. Consequently, a user in rural Kansas may receive the same smoothed probability map as a resident in dense urban Chicago, despite facing radically different micro-meteorological realities. The discrepancy between rendered output and actual ground-level conditions creates a dangerous false sense of security. When a cone of uncertainty is averaged out, the resulting data fails to capture the violent, localized turbulence that defines high-risk storm environments.
This piece examines the technical pipeline from radar arrays to smartphone screens. It details exactly where precision is lost, why rural sensor gaps persist, and how users can supplement standard applications with higher-fidelity sources to protect property and life.
The 40-Meter Grid: How Interpolation Smooths Out Localized Hail and Tornadoes
Most weather applications rely on numerical weather prediction models that operate on a grid spaced roughly 40 meters apart in high-resolution urban settings, though regional models often default to grids several kilometers wide. This spatial resolution creates a fundamental mismatch: a supercell thunderstorm producing baseball-sized hail may span only two or three grid cells, yet the app displays a broad, smoothed area of severe weather. The interpolation algorithms used to render these cells as colorful radar overlays or particle animations inevitably average out sharp gradients. A user standing at the edge of a tornadic circulation might see a gentle warning while their neighbor, just 100 meters away, faces direct debris impact. The technology prioritizes visual continuity over forensic precision, treating the atmosphere as a fluid rather than a chaotic, discrete event.
This smoothing effect persists because public radar data is often mosaicked from multiple terrain elevations, introducing vertical bias when mountains obstruct beam paths. While machine learning models are beginning to refine nowcasts by ingesting real-time social media reports and IoT sensor data to adjust for local microclimates, these systems still struggle with the latency required for imminent threats. For the average user, the practical consequence is a false sense of security; the app’s polished gradient suggests a predictable weather front, whereas the true local reality is often a patchwork of violent, short-lived microbursts that no 40-meter grid can reliably capture in real-time.
Sensor Gaps in the Heartland: Why Rural Areas Receive Stale or Missing Data
Weather applications rely heavily on a patchwork of ground-based observations, yet the density of these inputs varies wildly across the United States. In metropolitan hubs, networks of mesonet stations, airport weather towers, and radar sites overlap frequently, creating a high-resolution mosaic of current conditions. In contrast, vast stretches of the rural Heartland may have only a single Automated Weather Station (AWS) within a fifty-mile radius. This sparsity means that app algorithms often have to interpolate data from distant points, effectively guessing local microclimates rather than measuring them. The result is a lag time where a user in a small town might see a "clear sky" reading while a localized convective cell is already forming on their horizon, compromising the accuracy of any live weather alerts today.
This gap is not merely a technical inconvenience; it creates a significant safety blind spot. Doppler radar, the backbone of severe storm detection, operates on a line-of-sight basis and struggles to see through dense cloud tops or beneath lower cloud decks. When ground truth data is absent, the model cannot correct for these radar artifacts. Consequently, forecasters often issue broader-area warnings to maintain safety margins, which can lead to over-alerting in areas that ultimately remain unaffected. For residents in low-population counties, this trade-off often means receiving alerts that feel generic or delayed, forcing them to rely on visual cues—like wind direction or cloud base height—rather than digital precision.
From NEXRAD to Your Phone: The Latency and Filtering Steps That Dilute Urgency
The journey from radar detection to smartphone notification involves a significant delay, often referred to as latency. When NEXRAD Doppler radars detect a storm, the data must be processed, validated, and disseminated through the National Weather Service (NWS) infrastructure before reaching third-party apps. This pipeline can take anywhere from three to ten minutes. During this window, a localized downpour might begin and intensify, yet the user’s alert remains generic. This gap is not a glitch; it is an architectural necessity to prevent false alarms that would desensitize the public. As detailed in guides on Navigating Financial Markets, understanding the mechanics of rapid data dissemination is essential, yet in weather technology, speed often trades off against precision.
- Radar-to-phone latency typically ranges from 3 to 10 minutes.
- Third-party apps often filter out minor alerts to reduce noise, potentially missing hyper-local events.
- Users should treat push notifications as a baseline, not a real-time replacement for local observation.
Once the alert reaches the device, app developers apply additional filtering layers to improve user experience. Many popular weather applications suppress low-confidence warnings or those that have already been issued for the current hour, fearing alert fatigue. However, this approach can obscure rapidly evolving threats, such as flash floods in specific river basins that may not trigger a broad statewide warning. In practice, this means a user inside a specific flood zone might receive a generic "Flooding Possible" notification for their county, while the critical, street-level detail remains buried in a longer text message or a separate NWS site. The trade-off is clear: cleaner notifications at the cost of granular urgency.
The Cost of False Reassurances: Misinterpreting 'Low Probability' in High-Risk Zones
Probabilistic forecasts often trigger a cognitive bias where users equate low likelihood with low severity. A 20 percent chance of a destructive hailstorm is statistically significant for localized impact, yet many apps display this as a muted icon, relying on user interpretation. This design choice assumes a level of meteorological literacy that most casual users simply do not possess. The interface fails to communicate that localized convective events are inherently stochastic; a low probability does not negate the potential for catastrophic damage to a specific rooftop or vehicle.
This disconnect becomes dangerous when weather alerts today are interpreted in isolation from local topographical risks. For instance, residents in areas prone to rapid flash flooding may dismiss a moderate rainfall warning if the app labels the event as "isolated." As seen in communities preparing for Sheffield Residents Brace for such patterns, the nuance of local terrain is often lost in broad algorithmic outputs. The practical consequence is that users remain stationary while conditions deteriorate, mistaking a statistical abstraction for a guarantee of normalcy. To mitigate this, apps must move beyond simple probability percentages and integrate severity weights that reflect potential physical harm, forcing the interface to prioritize impact over mere likelihood.
Supplementing Your App: Using SPC Outlooks and Local Spotters for Hyper-Local Accuracy
Commercial weather apps often conflate the entire United States into a uniform risk grid, but the Storm Prediction Center (SPC) operates on a granular scale that most consumer interfaces fail to surface. By directly accessing SPC Day 1 and Day 2 convective outlooks, a user in a specific microclimate can distinguish between a marginal risk zone and a high risk area. This distinction matters because a 'slight risk' category still carries a non-negligible probability of severe wind or large hail, yet many apps bury this nuance behind generic color-coded maps. For those interested in how data integrity affects long-term decision-making in other sectors, observing how real-time data is referenced in specialized reports offers a parallel lesson in precision; a similar analytical depth is applied in Emlak Piyasasında Konut Yatırımları: 2023, where accurate market signals prevent costly missteps.
Supplementing these official resources with local spotter networks allows for a form of hyper-local verification that algorithms alone cannot replicate. When a spotter reports a rotating wall cloud at 19:45, that ground-level data points to mesocyclone formation minutes before it typically appears in model output. Integrating this human intel with the statistical framework of the SPC provides a more robust operational picture. Users should, however, treat spotter reports as supplemental data points rather than absolute truths, as human error in identification or timing is inevitable. The goal is not to replace official warnings but to contextualize them, ensuring that weather alerts today are interpreted with the local ground reality in mind.
Bridging the Gap Between Data and Danger
Modern meteorology has achieved remarkable precision, yet the final mile of data delivery remains fraught with technical and structural limitations. The compression of complex atmospheric dynamics into a casual swipe on a smartphone screen introduces unavoidable smoothing effects, latency, and contextual ambiguity. For the average user, this means that a green radar screen does not equate to safety, nor does a generic alert guarantee relevance to their specific street. The technology is robust, but its interface is often deceptive.
Reliance on a single commercial application for situational awareness is inherently risky. The most effective strategy involves triangulation: cross-referencing app data with official National Weather Service products and, in high-risk regions, local storm spotting networks. Users must treat weather forecasts as probabilistic guidance rather than deterministic guarantees. When severe weather approaches, the margin for error shrinks, and the simplicity of an app's UI can obscure the severity of the threat.
While improvements in sensor density and AI-driven modeling promise finer resolution, the fundamental challenge of translating grid-based science into individualized risk assessment persists. Until that gap closes, personal vigilance remains the most reliable safety tool. Check weather alerts today through multiple authoritative sources, and never let a quiet notification silence your own judgment.
Which sources do you trust when the sky turns dark, and how do you verify that the data reaching your device hasn't lost its urgency in transit?
Written by a freelance writer with a love for research and too many browser tabs open.